

Introduction
The mechanical properties of polymers are defined by many of the same parameters used for metals, such as modulus of elasticity, yield strength, and tensile strength. For many polymeric materials, a simple tensile test is used to determine many of these mechanical properties. The mechanical properties of polymers are, in most cases, very sensitive to the rate of deformation (strain rate), temperature, and chemical nature of the environment (presence of water, oxygen, organic solvents, etc.). These properties distinguish polymers from small molecules and provide polymer scientists or engineers with a great deal of information about how polymers can be used.
This article briefly examines the tensile properties of polymers.
Keywords: Mechanical properties, tensile test, stress-strain diagram.
Tensile test
Most thermoplastics are inelastic, meaning that stress and strain are not linearly related in most parts of the stress-strain curve. The behavior of these materials is usually viscoelastic, meaning that when an external force is applied to a thermoplastic polymer, the material exhibits both elastic and plastic (or viscous) deformation. The mechanical behavior of polymers and their deformation (strain) depends on how the polymer chains move under the load (stress) applied to them.
The most basic test for determining the mechanical properties of a material is the tensile test. In a tensile test, the material is stretched uniformly.
Since the force acts on a cross-sectional area, stress is defined as the force per unit area:
σ=F/A
where σ is the stress, F is the applied force, and A is the cross-sectional area of the sample.
Similarly, strain is defined as the percentage change in length. So strain is the change in length divided by the original length:
ε=∆L/L
Where, Ɛ is the strain, L∆ is the change in length, and L is the initial length.
In general, when a sample is stretched, its length increases and its cross-sectional area decreases. However, in calculating engineering strain, the change in the cross-sectional area of the sample is ignored.
Stress and strain are affected by temperature changes and long-term time (creep), and repeated stress (fatigue) affects strain.
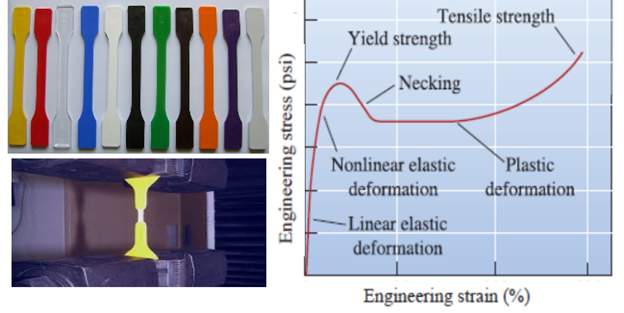
Tensile properties are evaluated by placing a dumbbell-shaped specimen between two clamps of a tensile machine that are pulled apart at a constant rate using hydraulic or mechanical force until the specimen ruptures. In this case, the applied force (tension) and the elongation (strain) induced in the specimen are measured. Since the cross-sectional area of the polymer specimen is considered constant, a stress-strain diagram can be plotted (Figure 1). The stress-strain curve can provide information about strength, toughness, stiffness, ductility, etc.
As mentioned, the mechanical properties of polymers are highly sensitive to temperature changes. For example, Figure (2) shows the stress-strain diagram of polymethyl methacrylate (PMMA) at temperatures of 4-60°C.
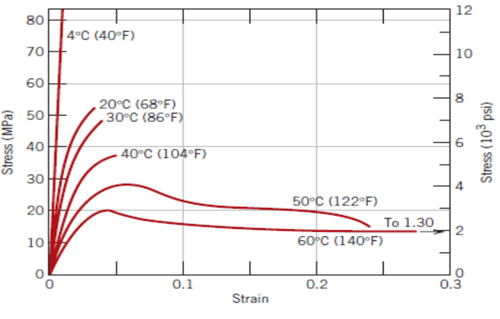
Reducing the deformation rate also has a similar effect on the stress-strain curve of polymers, meaning that as the strain rate decreases, the material becomes softer and ductility increases.
Different regions of the stress-strain diagram
The stress-strain diagram of polymers consists of different regions, which are explained below. Figure (3) shows the regions of the stress-strain diagram of a polymer sample under tensile test:
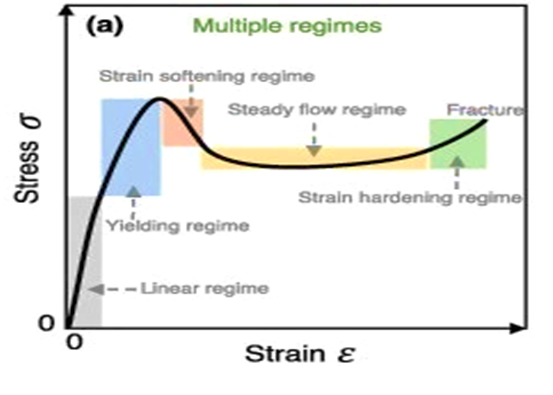
These areas include:
1-Elastic area
When a material is first subjected to stress, it initially exhibits elastic behavior. Elastic behavior means that although the material is deformed under stress, it returns to its original state after the stress is removed or removed. This is because the atomic bonds stretch and return to their original state after the stress is removed. Therefore, elastic behavior, although small, occurs in all materials.
Young’s modulus is calculated from the slope of the elastic region.
2-Plastic area
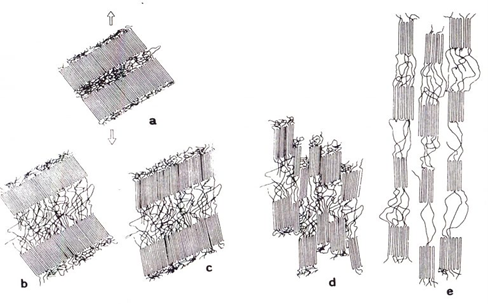
The highest point on the stress-strain diagram is called the yield zone. When the material reaches the yield point, it enters the permanent deformation zone. The stress and deformation corresponding to this point are called the yield strength and elongation at yield, respectively. Beyond the yield point, the material stretches and expands significantly, and this zone is called the plastic zone. Further elongation and stretching of the sample leads to the phenomenon of strain hardening. In this zone, the polymer chains first lose their elasticity (yielding) and then the sample undergoes transverse contraction and longitudinal stretching in a region and takes on a neck-like shape, which is called necking. The necking phenomenon progresses until the deformation of the chains becomes aligned. In the plastic region, the strength of the sample increases due to the orientation of the chains in the direction of tension. Eventually, the necking phenomenon spreads along the length of the sample and the sample ruptures. Figure 4 (a-e) shows the mechanism of polymer chains in the tensile test and the strain hardening phenomenon for a semi-crystalline polymer sample:
The maximum stress value on an engineering stress-strain curve is called the “ultimate tensile strength.” This value is the highest stress that the specimen can withstand. The deformation corresponding to the breaking point is also called the elongation at break.
The stress-strain behavior of a polymeric material depends on the molecular and microstructural properties of the polymers. Polymers can have very different stress-strain behaviors, especially because specific polymer interactions can change at different stress levels. Figure 5 shows the types of stress-strain relationships obtained for different polymer groups.
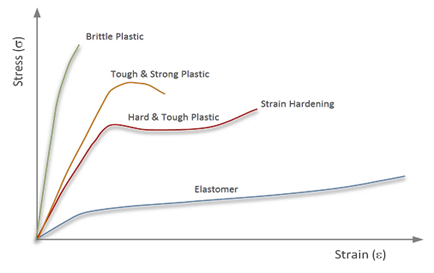
From the image above, it can be inferred that rigid materials have a high Young’s modulus, but when exposed to stress, they fracture more quickly than other groups and are called brittle plastics. Polystyrene (PS) is one of these polymers.
In contrast, the last graph shows the mechanical behavior of the rubbery group of polymers called elastomers, which have both low Young’s modulus values and can withstand large amounts of reversible tensile stress before rupture.
The second curve is for semi-ductile materials such as polymethyl methacrylate (PMMA), and finally the third curve is for ductile materials, whose modulus is lower than that of rigid and semi-ductile materials, but when comparing the area under the graph of these materials with other groups, their toughness is higher and they withstand more energy until reaching the point of rupture. Polycarbonate is included in this group of materials.
Conclusion
Tensile properties are one of the most important mechanical properties of various polymers. Understanding and examining mechanical properties is one of the most important parts of producing polymer products and, more than other properties such as thermal, optical, and rheological properties, provides the manufacturer with the ability to compare materials and control their quality in order to improve the properties of the manufactured product. Tensile testing is used to determine mechanical properties. In this test, the product under test is subjected to tensile force until the breaking point, and at the same time, the elongation is recorded simultaneously with the applied load force. The results of this test are used to control quality and predict how a material will react under various forces. The result of this test is a stress-strain curve, which characterizes the behavior of the material under tension. The data obtained from this test is used to determine the mechanical properties of the material. Compiled by: Samin Saleki
Scientific Editor: Marzieh Shams Harandi
Resources
1.https://insights.globalspec.com/article/7810/how-to-perform-tensile-testing-on-polymers
2.https://msestudent.com/stress-strain-and-the-stress-strain-curve/
3.https://eng.libretexts.org/Bookshelves/Materials_Science/Supplemental_Modules_(Materials_Science)/Polymer_Chemistry/Polymer_Chemistry%3A_Mechanical_Properties
4. https://polymerinnovationblog.com/characterization-thermosets-part-21-tensile-testing-polymers-molecular-interpretation